Lari Yield Curve Methodology
Currently, secondary capital markets in Georgia is not characterized by sufficient liquidity, therefore primary market data is used for estimating GEL Yield Curve. Auction results for Treasury Bills & Notes issued by MoF and Certificates of Deposits issued by NBG.
The following six maturity points are used for calculating GEL Yield Curve: 6 month, 1, 2, 5 and 10 year Treasury Bills & Notes and 3 month Certificate of deposits issued by NBG. For every maturity point, only newest auction results are taken into account and auction results should not be older than 120 calendar days to be used in calculations.
If latest 10-year maturity Treasury Notes auction was conducted more than 120 days ago, then:
a) 10 year maturity point may not be used in calculations and 5 year point would be the highest maturity point used, or
b) 10 year Treasury Note would be substituted by a synthetic bond with YTM and Coupon that is equal to YTM of latest 5 year Treasury Note plus term premium (10Y-5Y) derived from last two years of historical observations.
Modelling method
GEL Yield Curve is modeled using Nelson-Siegel parametric model. NS model is widely used in the central banking community for modelling yield, curves.
NS model has the following modified form (Diebold and Li [2006]):
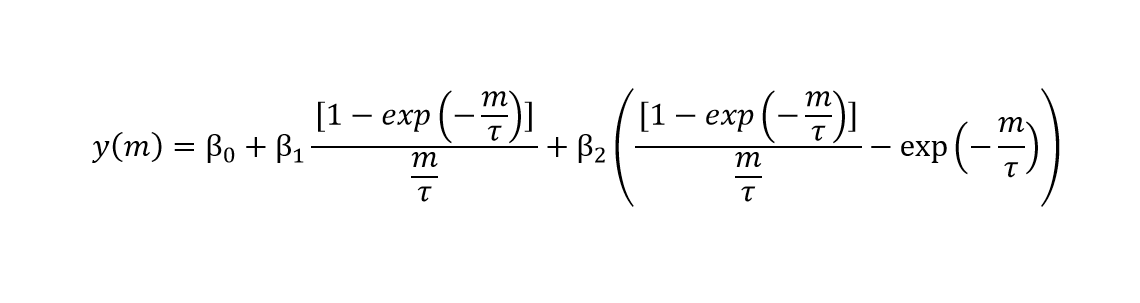
Main parameters, which must be estimated, are β0, β1, β2 and τ.
- β0 – Determines level parameter
- β1 – Determines slope parameter
- β2 – Determines curvature 0 parameter
- τ – Determines a place of curvature parameter and also affects weights of β1 and β2 (based on historical analysis is fixed at 1.39237)
After every primary auction, these NS parameters are estimated by finding the best numerical combination to achieve the closest match to observed YTMs. The “closeness” is measured by least squares method (i.e. minimizing sum of squared differences between the modelled and the observed YTMs).
GEL yield curve is published weekly, on Tuesday, after completion of every primary auction of Treasury Bills & Notes or Certificates of Deposits issued by NBG. Historical database of GEL Yield Curve consists of weekly data starting from year 2013. Online tool allows comparison of GEL Yield Curves for different dates the downloading of historical data in excel format.
National Bank of Georgia reserves the right to change the GEL Yield Curve calculation methodology by its sole discretion.